

2H 2026 Global M&A Outlook: Embracing the Volatility Paradox

At the close of 2025, leaders were starting to think big and build bigger. The first half of 2026 delivered on that ethos—and then some.
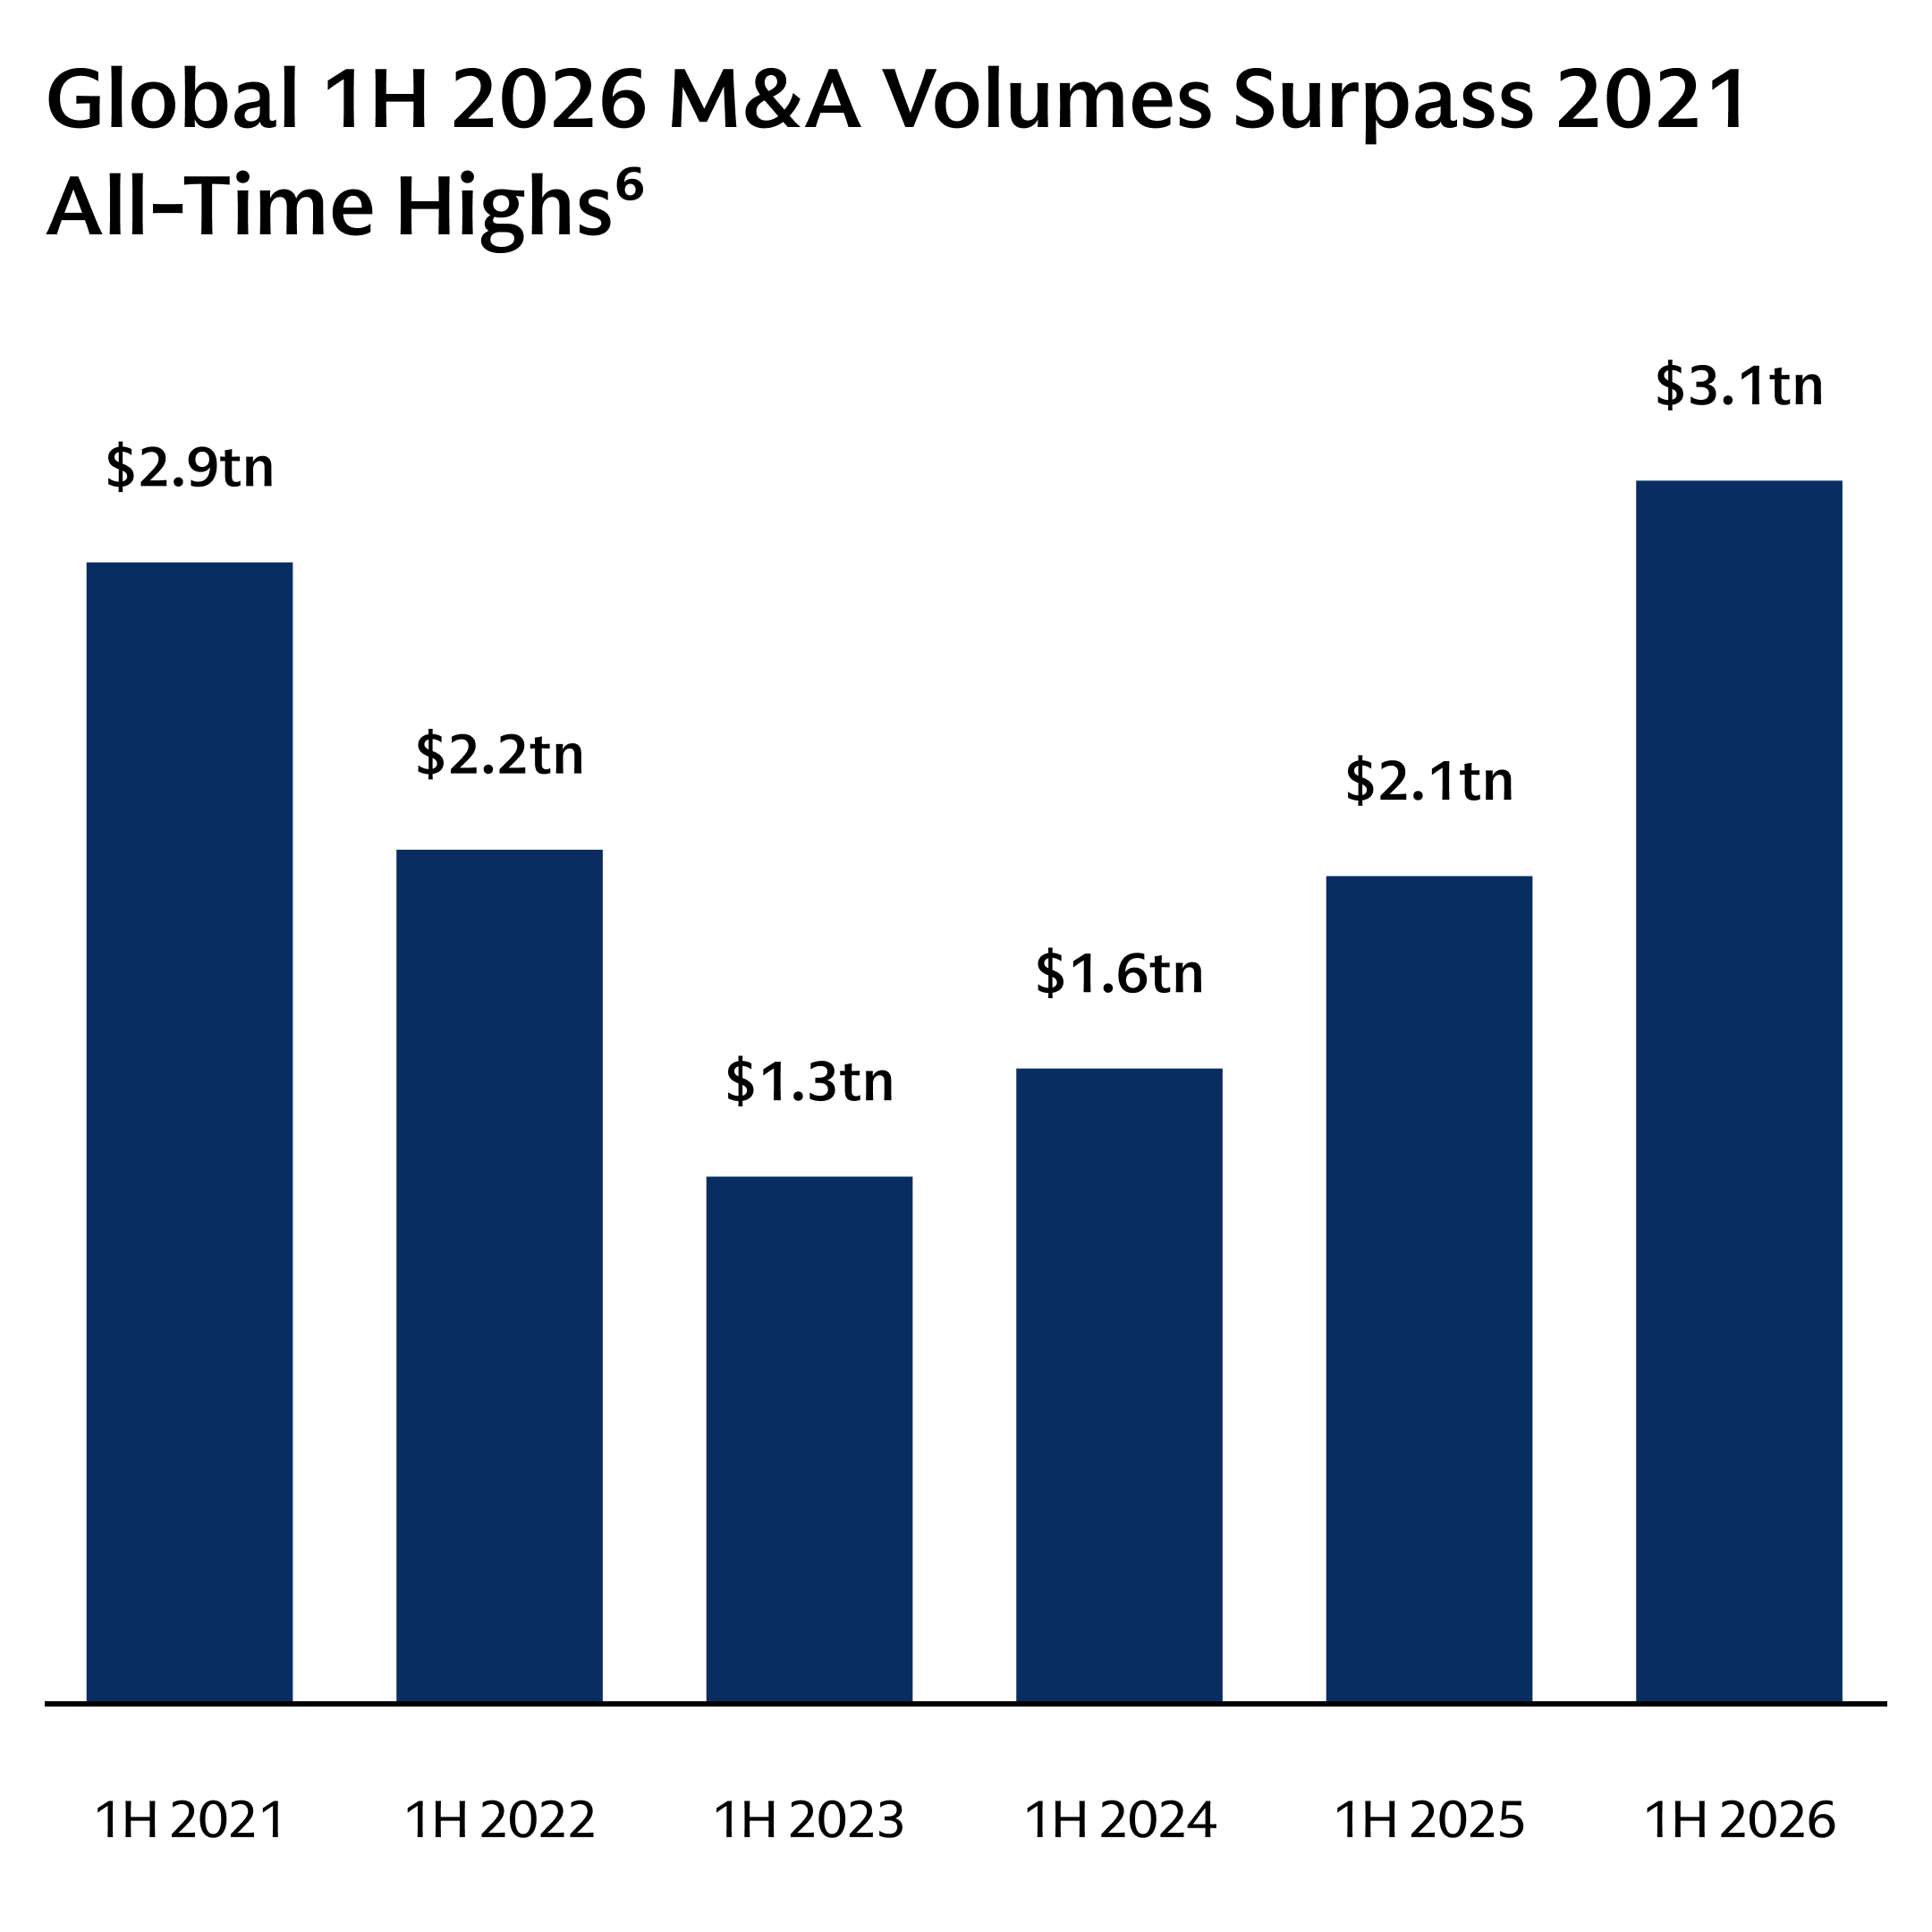
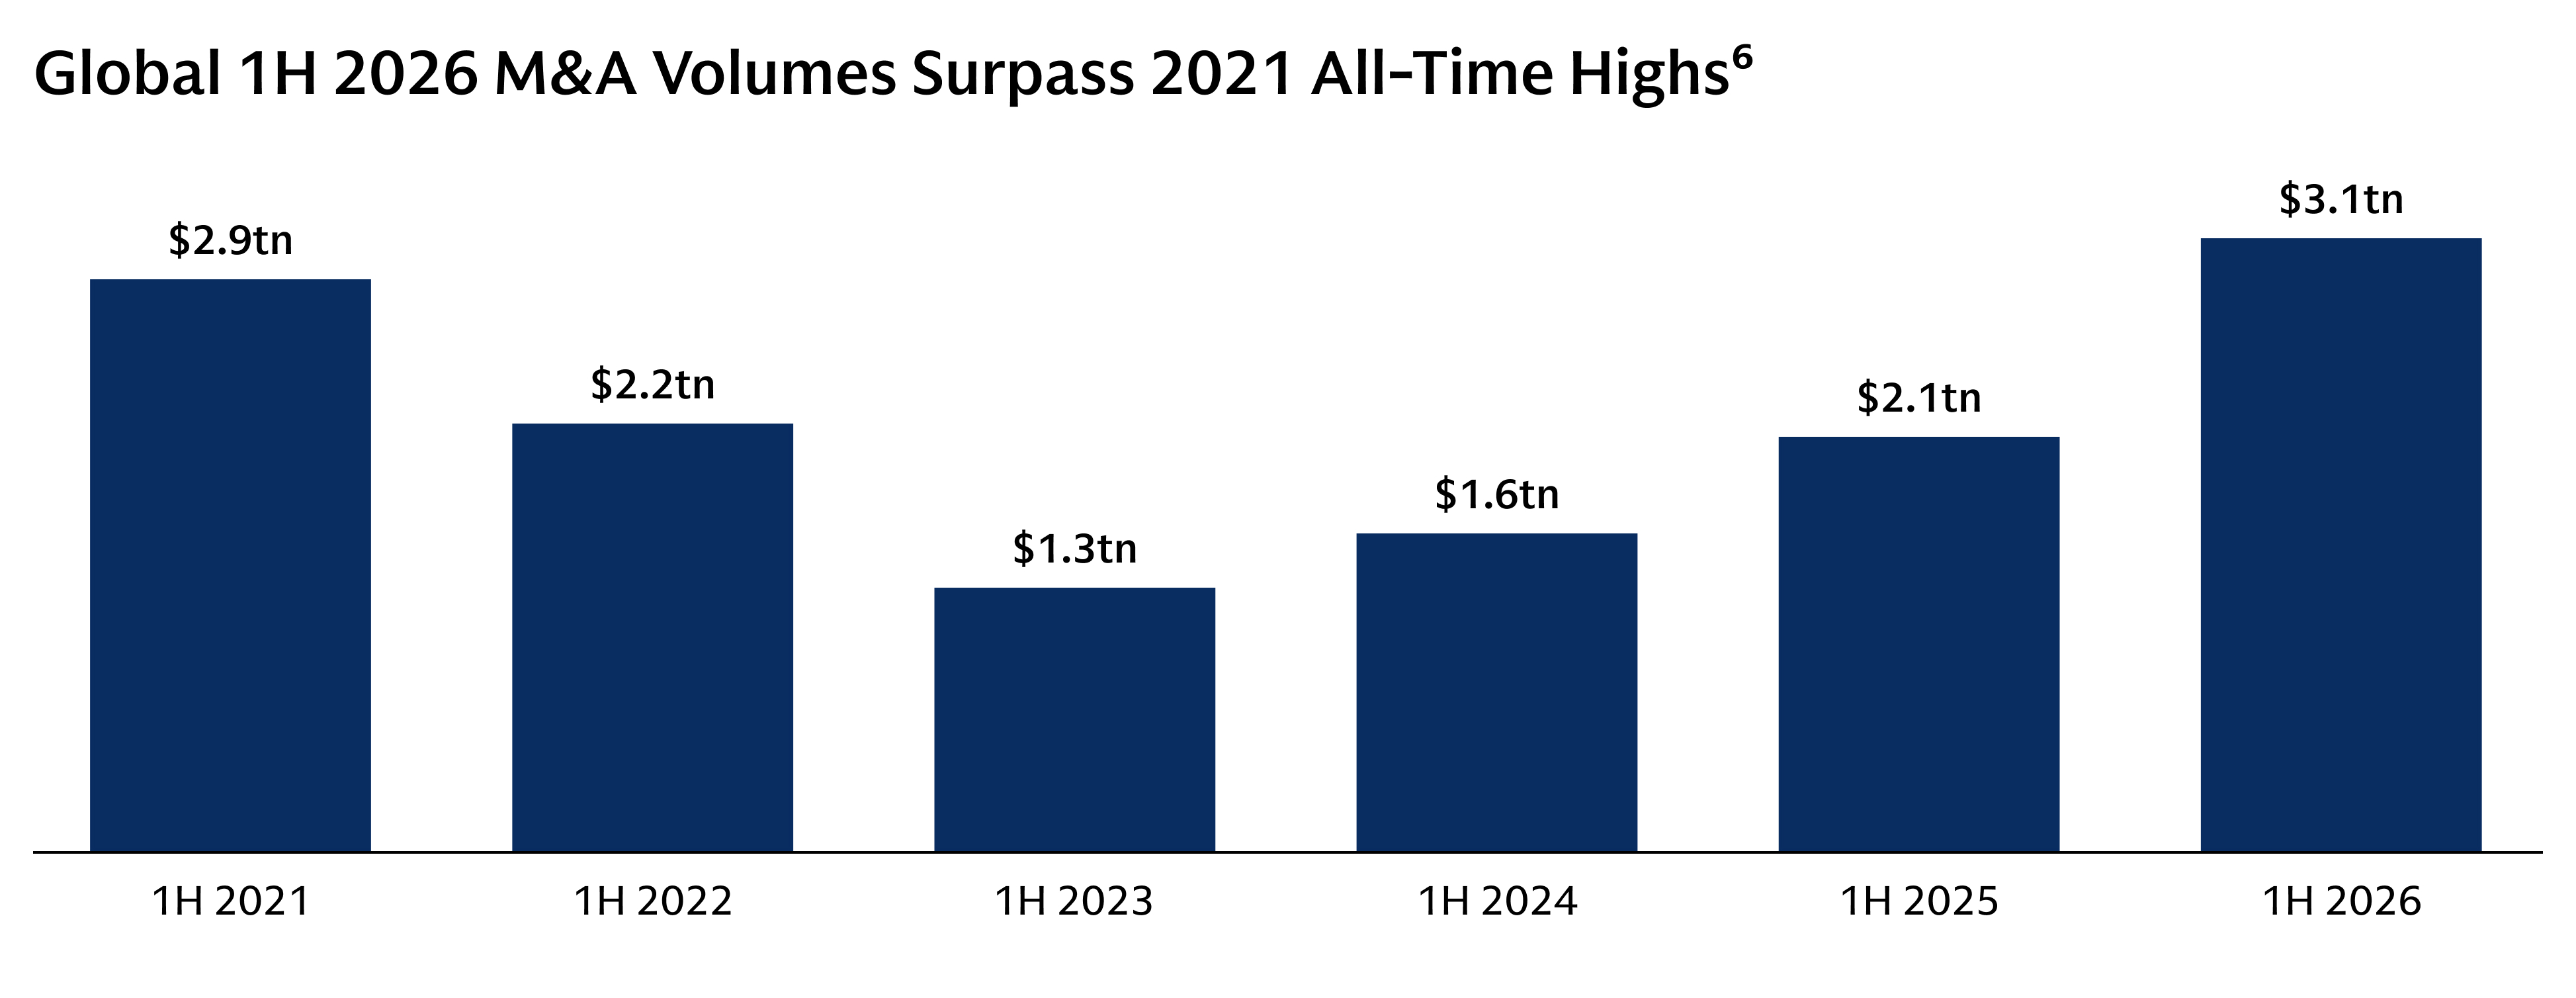
Global M&A volumes rose 48% YoY1 against an unusually supportive backdrop: strong equity markets, a stabilized regulatory environment, and conducive financing markets that support today’s supercharged innovation economy. Notably, this uptick is driven primarily by the surge in deal size, with mega M&A volumes +125% YoY.2 M&A has always been anchored by two fundamentals: cyclicality and growth. We expect we are only in year four of the current M&A cycle with substantial room to run, despite long-standing geopolitical and inflationary pressures. A volatility paradox has emerged, wherein strategic urgency is overriding macroeconomic uncertainty.
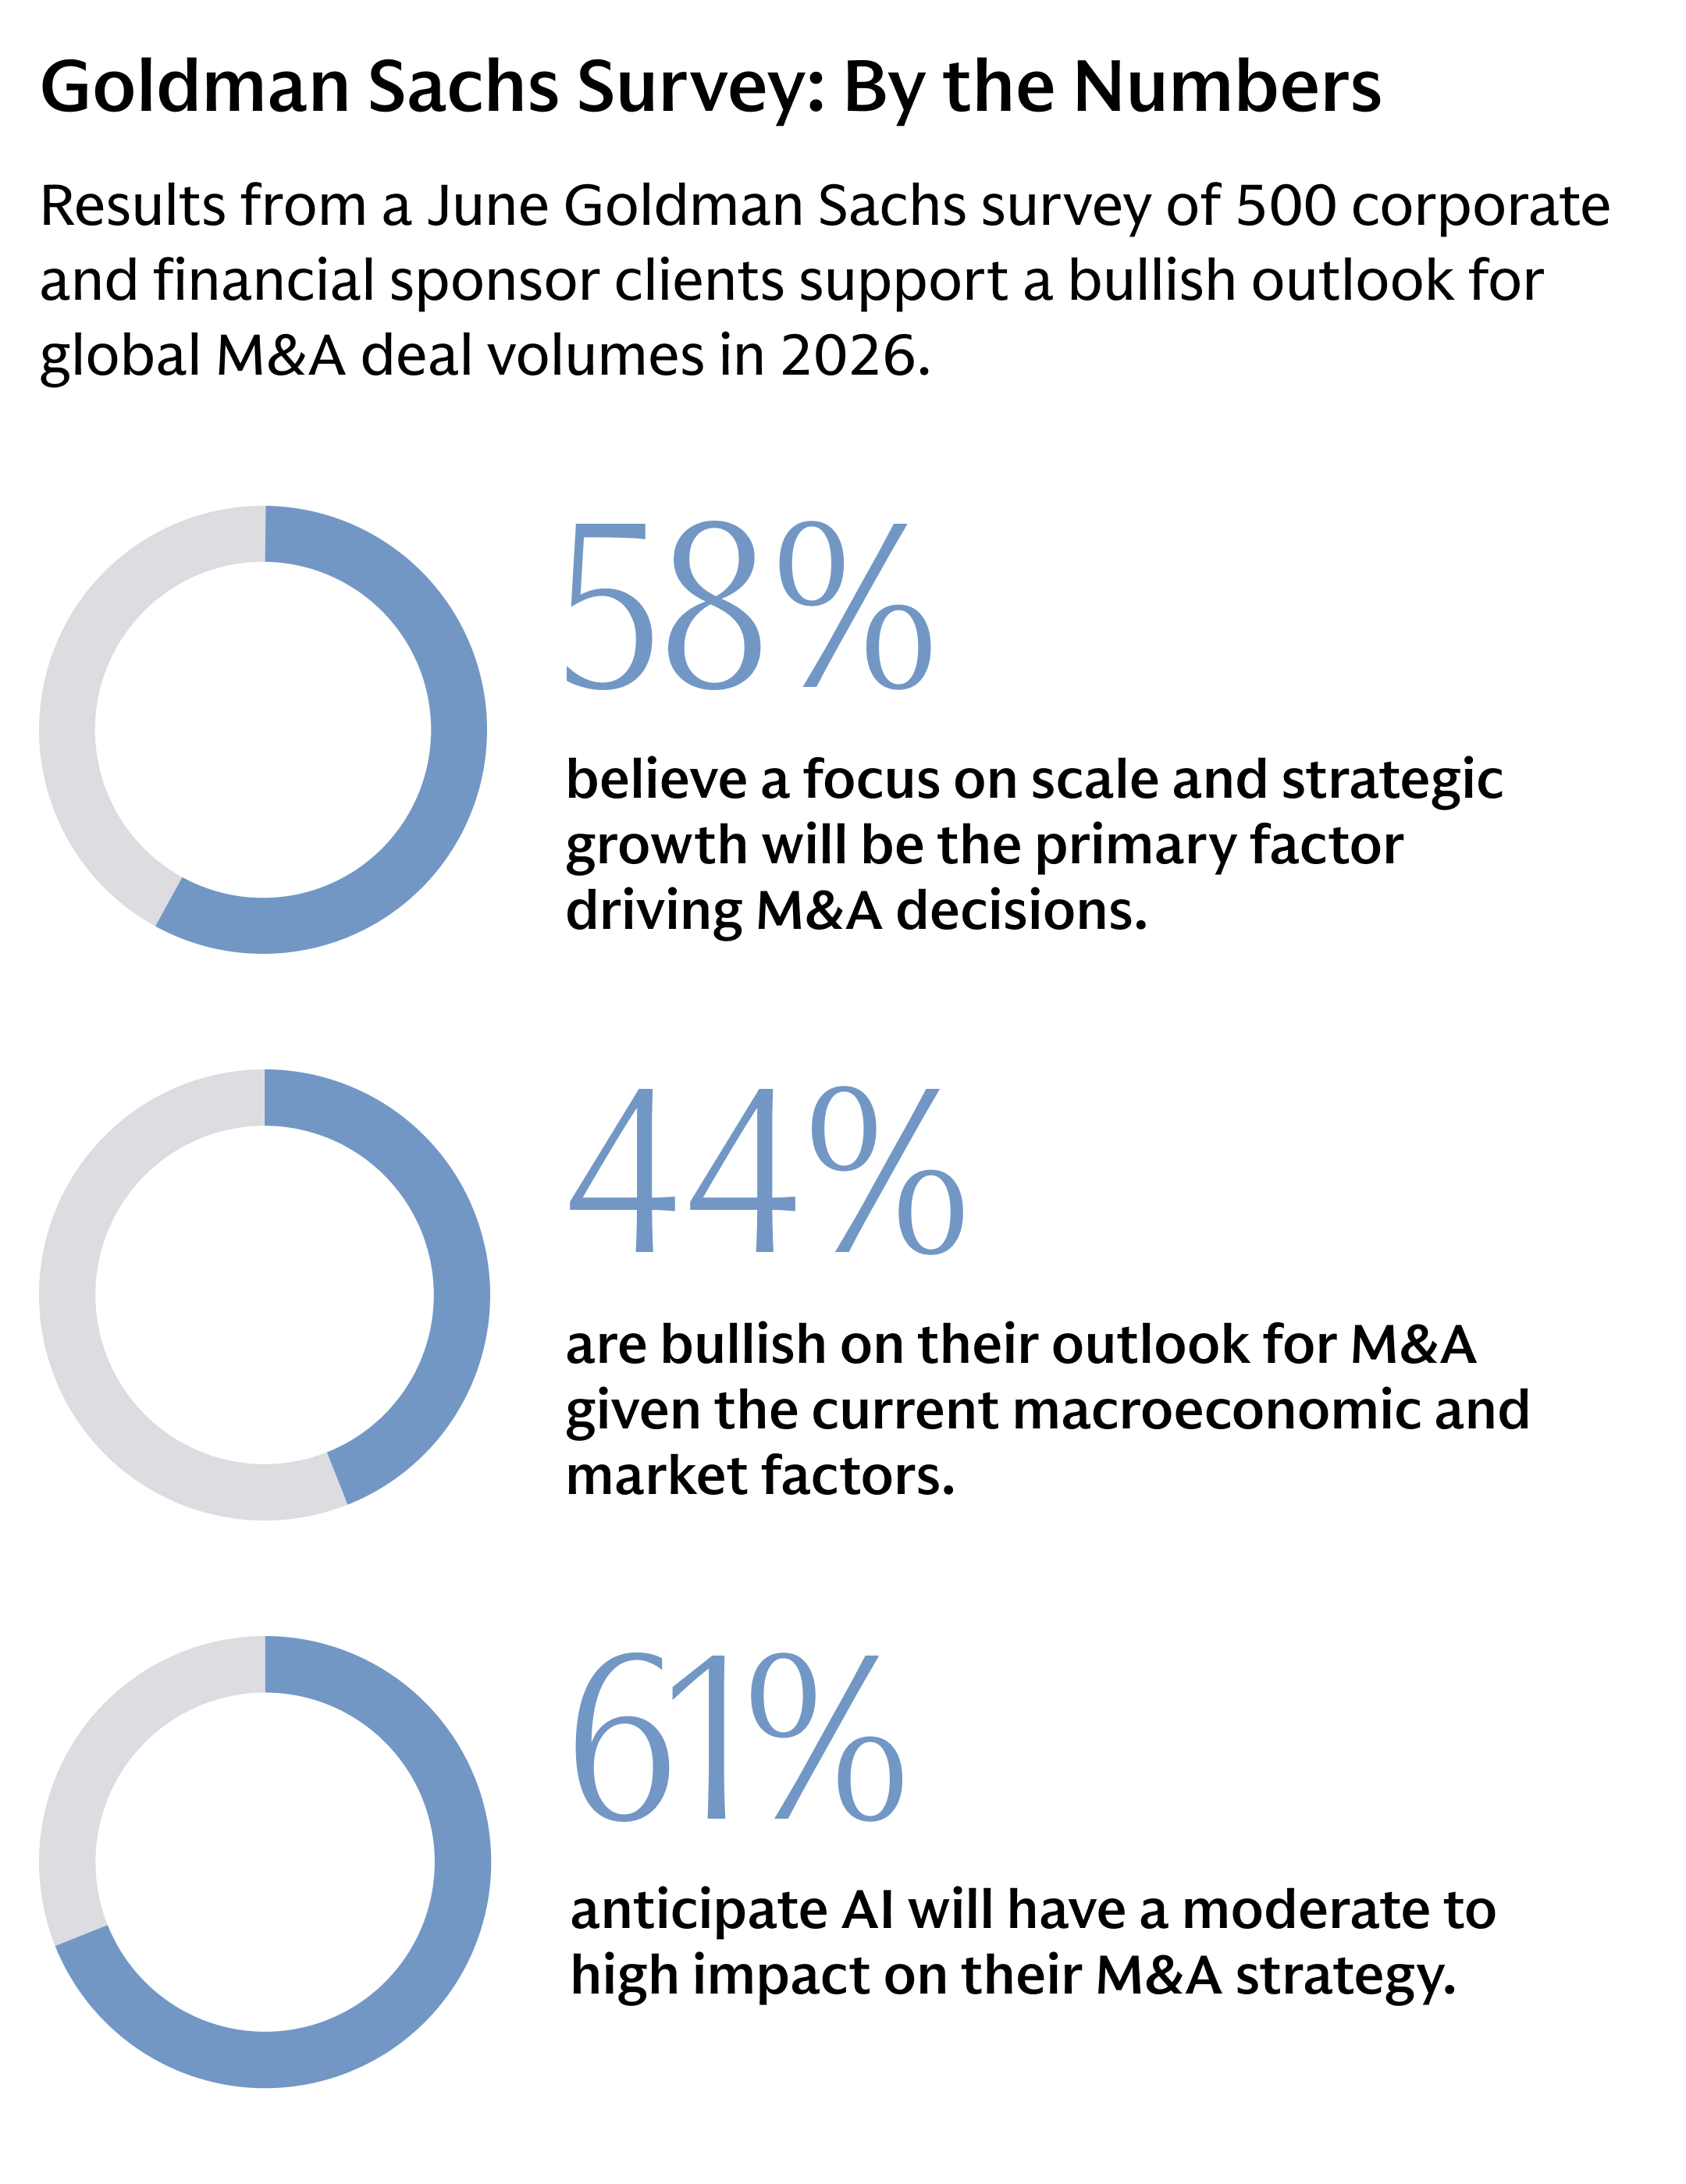
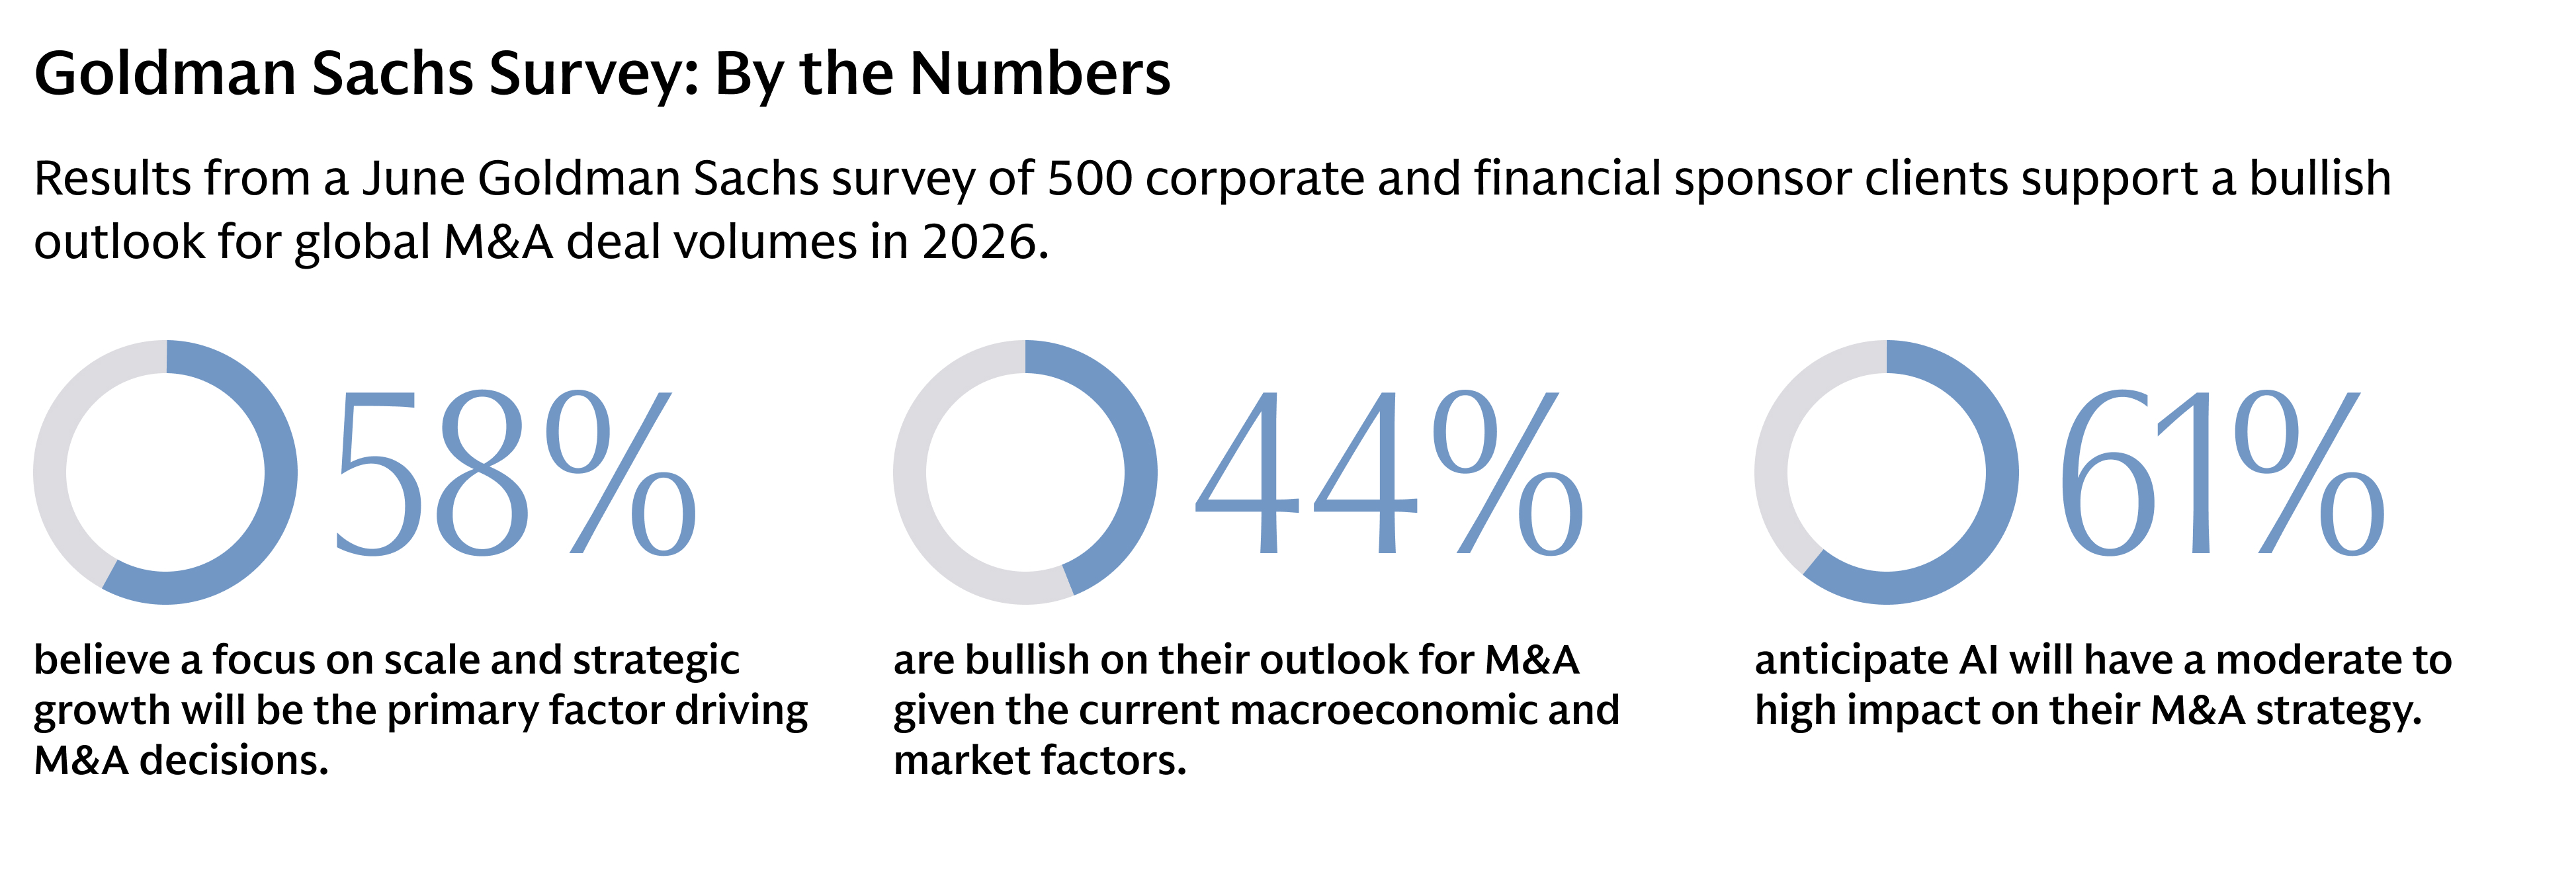
Our June 2026 survey of more than 500 corporate and financial sponsor clients punctuates this sentiment: Nearly half say current conditions make them more willing to transact.3 That competitive anxiety is palpable: AI-related deals are reshaping industries, portfolio moves are sharpening focus, and sponsors are navigating an ever-tightening market. The risk of standing still has become greater than the risk of execution.
The AI Supercycle and the Next Wave of Transformative M&A
Today’s market is defined by the “tyranny of terminal value”—an asset’s future worth informs its price today—underpinning a shifting valuation paradigm focused on long-term, durable investments. AI amplifies this, pushing investors to value long-term potential over near-term cash flows and making M&A as defensive as it is offensive. Leaders leverage M&A to both gain capabilities and signal they can withstand AI disruption. And while the world has become more geopolitically fragmented, cross-border dealmaking activity has only strengthened, as companies work to secure critical technologies, diversify supply chains, and deepen their presence in priority markets across regions.
This ambition is driving the rise of “DNA deals,” acquisitions that embed AI into an organization’s core rather than layering it onto existing products or processes. It’s a familiar refrain: During the move from enterprise software to cloud computing, incumbents turned to M&A to accelerate capabilities they could not build quickly enough on their own. This same logic now drives companies to acquire the models, systems, and protocols that are increasingly critical to compete in an AI-native economy.
What Comes Next: AI’s Impact on the Real Economy
A similar urgency is reshaping the real economy. As the demand for AI pushes infrastructure, power, and utilities to build faster, M&A becomes a strategic lever to scale. Hyperscalers’ new focus on nuclear power, data center developer investment in grid infrastructure, and industrial company deployment of AI-driven energy optimization are creating a new category of dealmaking at the intersection of technology M&A and energy infrastructure investment. The recently proposed combination of NextEra Energy and Dominion at an enterprise value of $118.8bn4 reflects this convergence.
Enterprise software was AI’s first proof point, but the next frontier is physical AI, represented by the roughly $100tn of global activity AI has barely touched.5 A restructuring is underway in industrial AI software, the operational layer of the stack where incumbents are embedding AI into the tools that design, simulate, and run physical operations. While less visible than the software sell-off, the scale is greater—spanning manufacturing, life sciences, energy, aerospace, and more. The leaders of this era will strategically leverage M&A to assemble and integrate these capabilities at scale.
Portfolio Focus: Concentrating Through Scale
Nearly 60% of survey respondents cite scale and strategic growth as their primary M&A drivers.7 And while AI is dominant in boardroom dialogue, it’s not directly fueling the majority of activity (yet). It has, however, created a material halo effect, pushing corporate leaders to scale, adapt, and consolidate while reassessing fundamental truths they took for granted just months ago. Industries are doubling down on key markets to gain a competitive edge in an increasingly winner-takes-all market—particularly amid rising activist pressure to accelerate portfolio optimization. Transactions like the $44.8bn Unilever Foods–McCormick merger8 and Merck KGaA’s $11.3bn purchase of Bio-Techne9 indicate the sharp focus across sectors on optimizing core businesses, with scale as the ultimate advantage.
That need to sharpen focus is also triggering a parallel wave of global separation activity (+145% YTD relative to the 2021–2025 average) as corporates shed noncore operations.10 In Q2, Honeywell completed the ~$88bn separation of its aerospace business,11 the last step in splitting into three focused leaders, and Comcast announced a spin-off of NBCUniversal and Sky.12 As boards realign broader portfolios to create pure-play entities, we expect this activity to continue.
Navigating the Flight to Quality and Exit Bottlenecks
Private markets are undergoing their own structural shift. Distributions sit near lows unseen since the financial crisis—leaving GPs with a backlog of roughly 16,000 companies held over four years, more than half of all buyout-backed inventory. Sponsors are now increasingly selective about where and how they deploy capital—with a notable focus on take-privates, asset consolidations, and founder-led LBOs.
As LPs’ calls for liquidity intensify, the assumption that companies can stay private indefinitely is being called into question. Despite longer holding periods, strong equity markets signal a path to liquidity—evidenced in Q2 by SpaceX’s landmark $85.7bn IPO,13 underscoring a focus on funding future growth; INNIO’s $2.8bn IPO,14 signaling sponsors’ ability to monetize stakes in the public markets; or the €29.4bn merger of KONE and TKE,15 highlighting sponsors’ focus on contributing portfolio companies into public entities for cash and stock. We expect distribution rates to return to historical averages as conditions steady and M&A accelerates.
The menu of exit options is also expanding. Continuation vehicles and other structured liquidity solutions continue to become more mainstream, allowing sponsors to return capital while retaining ownership of their highest-priority assets. Success will come to those who adapt differentiated, enhanced capabilities while prioritizing a flight to quality, with private markets notably holding roughly 30% of all software exposure.16 Going forward, durable, cash-generative, hard-asset businesses will be prioritized, while assets most exposed to disruption could face greater valuation pressures.
What Could Shift From Here?
While heightened CEO confidence and increased demand for growth will continue to fuel strategic M&A, prolonged macroeconomic uncertainty could shift the tone in boardrooms if leadership teams lack visibility on the forward and a proactive plan to navigate inevitable exogenous shocks.
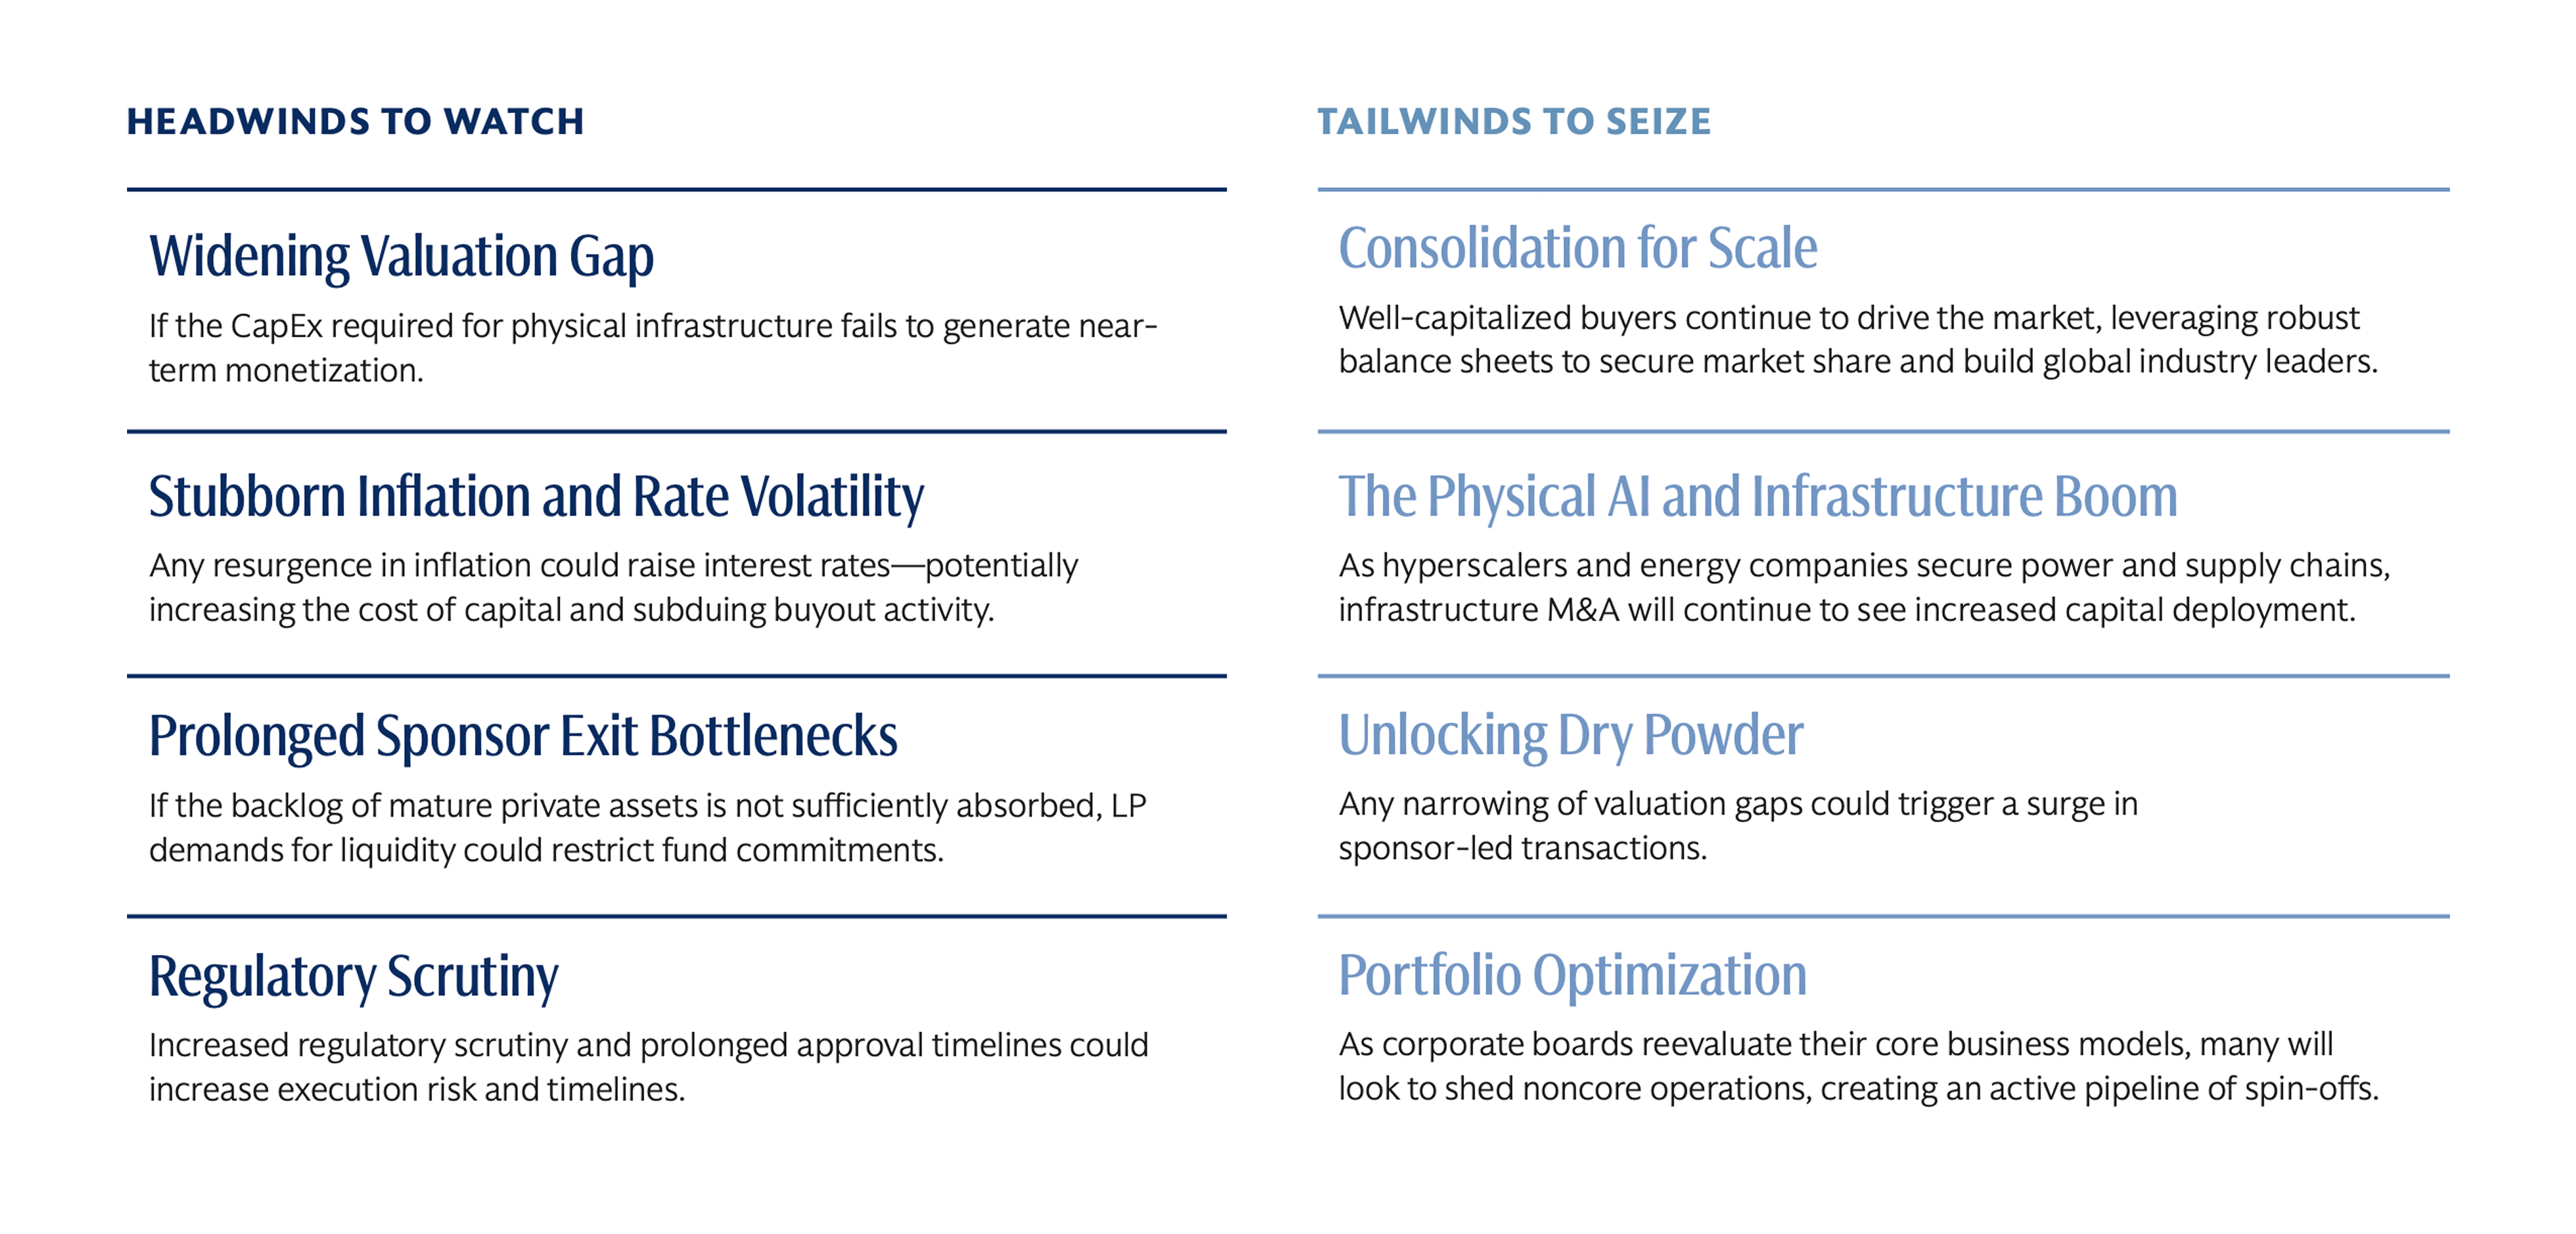
The second half of 2026 will likely see momentum persist, but deals will only grow more complex as volatility becomes the standard operating environment.
Our global Investment Banking business is built on a culture of enduring partnerships and a commitment to delivering exceptional execution in the most consequential moments. We look forward to partnering with our clients to do just that.
- 2H 2026 Global M&A Outlook: Embracing The Volatility ParadoxDownload the Outlook
Endnotes
1 Dealogic as of July 8, 2026
2 Dealogic as of July 8, 2026
3 Results based on a survey of 500 Goldman Sachs Investment Banking clients—including corporates, financial sponsors, sovereign entities, and nonprofits—conducted between June 15, 2026, and July 6, 2026.
4 Press release, May 18, 2026
5 Harnessing AI for the Real Economy, June 27, 2026
6 Dealogic as of July 8, 2026
7 Results based on a survey of 500 Goldman Sachs Investment Banking clients—including corporates, financial sponsors, sovereign entities, and nonprofits—conducted between June 15, 2026, and July 6, 2026.
8 Press release, March 31, 2026
9 Press release, June 25, 2026
10 Dealogic as of June 30, 2026, public company filings and press releases. Note: Deal value represents EV as of day one of regular way trading, calculated using open price.
11 Press release, June 29, 2026
12 Press release, June 29, 2026
13 Press release, June 15, 2026
14 Press release, June 3, 2026
15 Press release, April 29, 2026
16 Octus, February 26, 2026
17 Based on Dealogic reporting of cumulative announced M&A deal volume, the number of deals over $500 million in value, and associated market share from January 1, 2000, through June 30, 2026.
18 Dealogic—January 1, 2025, through December 31, 2025. M&A refers to both announced and completed M&A.